Windows?7 and 10,?64 bit only (32 bit available for limited releases)
STDF, ATDF, WAT, ASL, CSV, INK and many others. Any text file can be opened using the Generic File Import function. Many standard databases (Postgres, MySQL, SQLite) can be accessed and queried directly for offloading of data sets.
CSV (comma separated version) is not a data standard; it is a data delimiter. There are a few different types of CSV file data standards?that are handled by DataView. One type is an industry standard?developed?by National Instruments.??It contains items for all the common fields found in typical test data.
For most cases, the Generic Data Import tool in DataView can be used to import any text data file. The feature? shows a preview?of the data and allows you to select and identify the data elements and type. Save commonly used settings for opening other, similar files.
Lastly, DataView can process a simple form of CSV where the user defines the order and types of fields. This format is limited in functionality but can be useful for importing small sets of data (bench measurements).? The following explains this format:
Use the keywords #TESTNAME, #TESTNUM, #UNITS, #LOWLIM, #HILIM to identify test information for each column.??The following csv example contains 4 tests, each test runs 7 times:
#TESTNAME,test1,test2,test3,test4
#TESTNUM,1,2,3,4
#UNITS,A,V,A,V
#LOWLIM,0.1,1,0.1,1
#HILIM,0.5,2,0.5,2
,,,,,
,0.2,1.5,0.4,1.6
,0.2,1.5,0.4,1.6
,0.18,1.35,0.36,1.44
,0.16,1.2,0.32,1.28
,0.14,1.05,0.28,1.12
,0.12,0.9,0.24,,0.96
,0.2,1.5,0.4,,1.6
DataView generates reports in Excel 2007 (*.xlsx), Excel ?97 (*.xls), HTML, and PDF. Use HTML to build an easy-to-navigate local web report for comprehensive reports.
DataView also generates several different graphical formats for images, charts, and graphs, such as GIF, JPEG, and PNG.
Yes, a license is required to open and process your data files.??You can however install and run the fully operational software without a license file using the demonstration data files that come with the install.??The demo Session and data files provide several good examples of different analysis techniques and graph settings.??These demos are accessible either by setting the license manager to demo mode or by selecting ?Show/Hide Demos? under the Help menu.??The Demo menu will appear in?ProcessView.

The MAC address of your computer’s network adapter is needed to generate a unique license file for running DataView. ?To get the MAC address of your computer, do the following:
- Under the Start menu, select Accessories
- Click Command Prompt
- In the Command Prompt window, type ‘ipconfig /all’
- Look through the resulting output and find the physical address line for either your WIFI adapter or LAN adapter
- Record/Send this address when requesting a Node-locked license

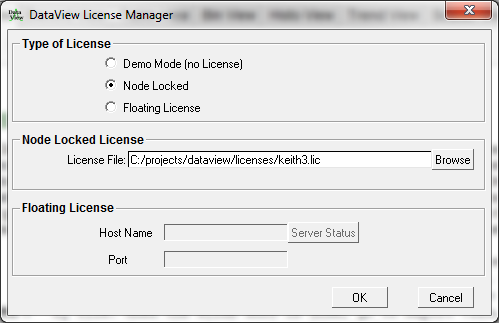
Once you receive your license file, save it somewhere accessible on your computer.?Next, download and install the latest version of DataView.??Once the install is complete, run DataView.??You should get a popup error saying your license file is not found or out of date.??Hit OK then in the main window, under the Edit Menu, select ?License Manager?.???Select your type of license (Node Locked or Floating). For ?Node Locked?, browse to the license file and hit OK.??For floating licenses, enter the license server host name and port, then select OK.??Use the ?Server Status? button to ensure the license manager can communicate with you license server.??Once the license file has been validated DataView should be operational.
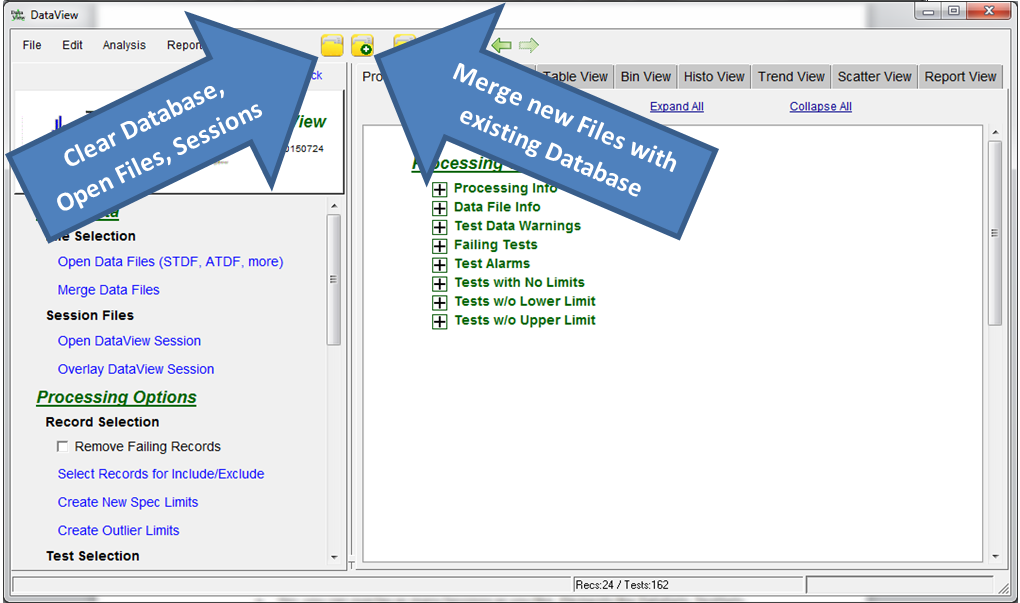
To open files, use either the Open menu item under file or the folder icon on the main tool bar.??With either, use the Open file window to browse and select your files.??You can hold the Shift or Control keys to make multiple selections. Use the Merge button or menu to add other files into your analysis session at any time.??You may select and add files of any type to your current session.??Using the Open menu or button will clear the database and reset DataView before opening all files. The Merge button/menu keeps the contents of the database and adds in the latest files.?The Merge button can be used as many times as necessary and at any time and will only add to the database.
Yes, files of different types can be opened at the same time.??Use the Merge functionality to open each of the different file types and the data will be added to the analysis database.
A Session is collection of graphs, tables, report items and analysis settings.??While working with DataView you can save a Session at any time.??This saves the current configuration of DataView as well as any report items, excluded tests, records, etc.??The Session file then allows you to return to your data at any time and get right back to where you left off.???The Session file contains the entire analysis project?s information as well as references to where the data files can be found.??When you open a Session file, DataView searches for the original files in their original locations (path)?unless the Session was saved with the database.??Without the save database, DataView will error if the original files are not found.??When Overlaying a Session, the original data files are not needed (and are ignored) because the settings, Report Items,?etc?are applied to the existing database.
Test data files can be huge and DataView can handle just about anything.??Large data files take time to open and process.??The ?Save Database? option allows you to freeze the state of the database and save to a file.??Restoring a saved database can be significantly faster than opening the original data files, saving time when working on a longer-term project.??Also, saved database files can be shared among team members, ensuring everyone is looking at exactly the same data.??Select the ?Save Database? checkbox in the Save Session dialog to package the database.

When you open, process, and analyze data in DataView, it creates an on-disk database.??The database is deleted when new files are opened and processed.??When you start DataView, if it finds a valid database it will ask if you want to restore the Session and database.??Selecting yes will result in a very fast restore/relink to the previous Session and allows you to continue where you left off.??This is convenient when you?re working on a large project that requires a lot of analysis.??You can simply exit DataView (without saving) and the next time you start, it will ask if you?d like to restore.
Session files can be used for new sets of data using the Overlay functionality.??Say you?ve developed a Session that has all the tests of interest, DataSets, TestSets, analysis sets, Report Items, etc.??Sometime later, you get new data from the same or similar test program.??You can open the new data files in DataView then Overlay your existing Session file.??The result will be the new data will be organized and presented using the same DataView elements (charts, graphs, sets) contained in the original Session.

Yes, you can overlay as many Sessions as you like. Elements like DataSets, TestSets, Report Items, excluded tests are all transferred and accumulated.??For example, if you?Overlay?one session that sets DataSets for Sites and another that sets DataSets for Files, the resulting Session with have both Sites and Files DataSets enabled.??This is actually a useful feature for building reports.??You can have Sessions that target different portions of your test program data, then pick, choose, and/or merge the different sections on new test data files.??For example, you can have one Session that targets the ADC tests, another that targets DC?parametrics, another for functional (pattern) tests, etc.??You can Overlay each of the Sessions onto new data and create a report containing all three, or apply them individually for quick, detailed analysis of the individual modules.
There are several ways to generate reports in DataView.??Most Views in DataView have a ?Save in Report? button near the top-middle of the graph or table.??Use this button at any time to save the data element you?re working on in the report.??This will result in a new Report Item in?ReportView.??Use the button in all views to save any interesting or important data for reporting.??Later, use the editing and processing features of Report View to group or organize your Report Items and save them to the output format or your choice.???Alternatively, you can quickly auto-build reports using the ?Report Builder? option under the Report menu.??This allows you to select your tests of interest, the types of charts, graphs, and tables, the report type and file, and other information.??Click OK and DataView will create your report and save it to your file.

ReportView is a useful repostitory for interesting graph settings, analysis setups, and table configurations.??You can create an interesting graph, table, or analysis set and click ?Save to Report?.??In ReportView, you?ll see a table entry for each Report Item created.??Double-click on the report item to return to the View and seettings that were used to create the graph.??You can then change the test and use the same settings and style on other tests or modify them to generate new Report Items.

Each of the Views in DataView has a quick graph/table button in the main toolbar.?This allows for quickly generating either a table (single .xls/pdf spreadsheet) or graph (.pdf, .png, .gif,?etc).??Use these buttons to generate the single image or table.??Alternatively, typing ?CNTRL-C? on any graph or selected cells of the tables allows for copying the image/table and pasting into emails or other tools.
In DataView, a Record is one set of test data from one run of a device.??If you tested a single part 10 times the result would be 10 test records.??Each record contains information about the device and overall performance (device id, serial number, binning information) as well as actual results for each of the tests performed (parametric test values, functional test pass/fail info).??RecordView?and?BinView?are good tools for identifying, grouping, and analyzing records.
A DataSet is a collection of test records, grouped by some common parameter.??All devices tested by the same hardware socket/probe site?is?an example of a Site DataSet.??Another example, all parts tested at cold temperature could be grouped and analyzed relative to other DataSets created from room and hot temperature data. Custom DataSets are easily created from most Views.??If you Zoom and select a group of devices, use the ?Switch Views? quick button to isolate the selected records into?RecordView.??Select the items in the Record Table and create a custom DataSet containing only your selection.

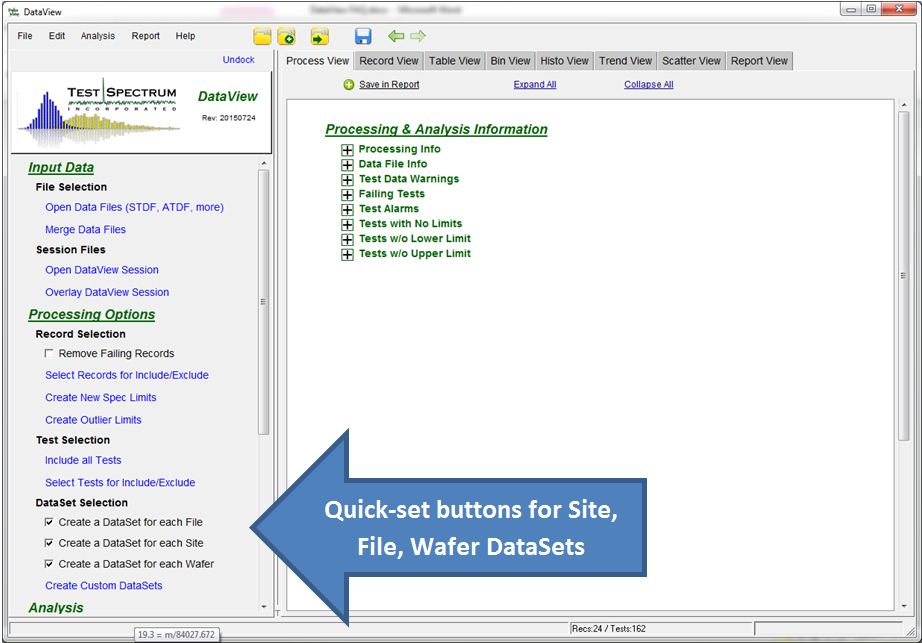
Yes, on the?ProcessView?tab in the control panel on the left, there are checkboxes for enabling or disabling DataSet creation for Sites, Files, and Wafers.??With these enabled, after opening your data files, you should have an auto-generated DataSet for each unique site, file, and wafer.
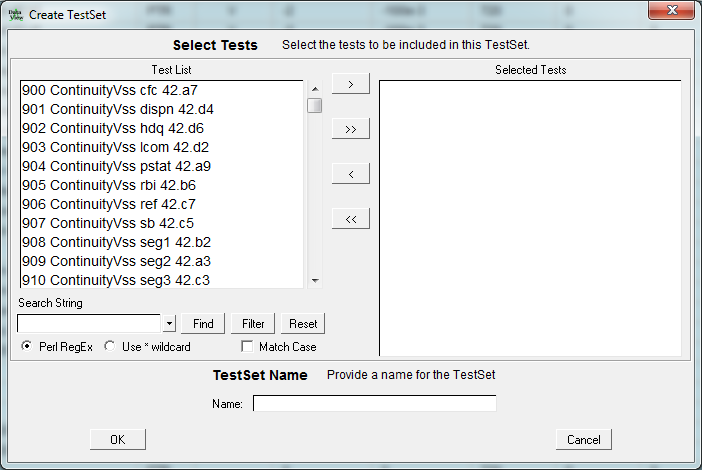
A TestSet is a collection or group of tests.??You can select and group any number of tests and create a custom name for the set of tests.??These sets can them be viewed and analyzed collectively.??TestSets are useful when analyzing parameters like voltage operation.??Typically, a test program may have the same tests performed at different voltages.??A TestSet can be created for the set of similar tests at different v voltages and?the an?analysis done across using the group.???You can create TestSets by selecting multiple tests in any of the Views, right-click, and select ?Create TestSet?.??Enter a name for the TestSet and click OK.
Outliers can be easily removed a number of different ways.??Most Views have a checkbox near the top middle of the graph for removing Outliers.??When this checkbox is selected a window will pop up asking what type of outlier removal to be used.

Select the type of outlier technique to use and hit OK.??You can set the default method by clicking the checkbox ?Make the default outlier limits? option near the bottom.??You can also create custom limits using the equation editor.??Select the ?Create Custom Outlier Limits? menu, under Edit, Edit Test Parameters.

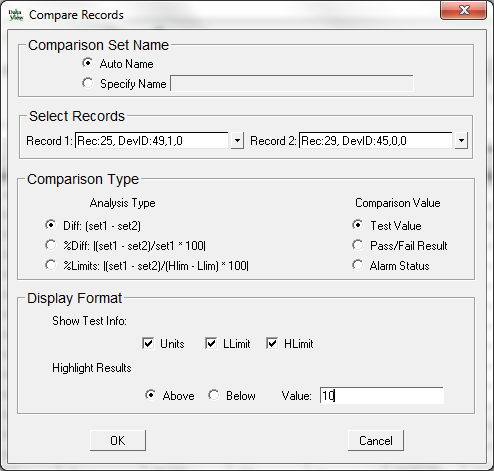
Comparing two records is easy with DataView.??Under the Analysis menu, select Compare, Compare Records.??Browse or select the two different records to compare, select the type of comparison, and display properties, then click OK
A report will be generated and displayed in TableView that contains the results of the comparison.
Yes, new spec limits are easy to generate and experiment with DataView.??Create new spec limits using the menu item under Edit, Edit Test Parameters,?CreateCustom Limits, ?Create new Spec Limits?.??This option allows you to generate equations for your spec limits for each selected test. Use statistical variables from any native or custom DataSet along with any valid mathematical expression.
The new limits will be used in any of the statistical equations, graphs, and analysis routines that use spec limits (Cpk, Zoom-to-Limits, etc).??Binning values are not affected by changing spec limits because there is no way to determine what the new binning would be with the new spec limits.

DataView has two powerful tools for doing correlation and characterization activities.??Under the Analysis menu, use the Compare, Compare DataSets menu option to analyze different groups of parts against one another.??Select the Tests to compare, the different combinations of DataSet comparisons, the statistic used in the comparison, and the display formatting.??Once done, a custom, sortable report will be generated in?TableView.??Similarly, test data performance can be compared against other tests using the Compare Tests utility.

Yes, new spec limits are easy to generate and experiment with DataView.??Create new spec limits using the menu item under Edit, Edit Test Parameters,?CreateCustom Limits, ?Create new Spec Limits?.??This option allows you to generate equations for your spec limits for each selected test. Use statistical variables from any native or custom DataSet along with any valid mathematical expression.
The new limits will be used in any of the statistical equations, graphs, and analysis routines that use spec limits (Cpk, Zoom-to-Limits, etc).? Use the Re-Bin function to apply the results of the new limit to a new bin. Devices that fail the new limits can be assigned to a new, custom bin. This operation can only be used to remove (fail) passing devices. Devices that?were already failing are not affected; their binning is not changed. In short, you can not change a failing device to passing but you can change a passing device to failing.
Yes, DataView can be used to do Process Average Testing (PAT). The ‘Create Statistical Bin Limits’ tool in DataView allows you to select the critical tests requiring additional, statistical binning. Enter the equations for the limits and enable for re-binning. The limits are applied to all devices and the binning information is changed for all new failures of the statistical test. All charts and data available in Record, Bin, and Table Views will reflect the new bin status.? The limits are also available for display in most graphs (Histo, Trend, and Scatter Views).

Editing and experimenting with your limits is easy with DataView.??In?TableView, select any View that contains columns for limits (Test Info, Statistics, Raw Data) and right-click on the limit column.??Select ?Edit Limits? and the limit columns will be highlighted yellow.??Modify the limits of interest, right-click and select ?Update Limits?.??The new values will be applied to the database and all calculations updated.

Restore the original limits easily using the Create Custom Limits interface.??Select ?LowSpecLim? for the lower limit, ?UpSpecLimit? to restore the original upper limit.Or use the menu options under Edit, Edit Test Parameters, Restore Spec Limits to easily return the original values.
DataView has a utility for analyzing limits to assist with generating statistically-based limits.??Under the Analysis menu, Spec Limits select the ?Analyze Spec Limits? menu.??This interface allows you to select the tests of interest as well as the analysis technique to use.??Limits are processed and reported in a custom graph in?TableView.

Most Views have settings that allow for changing how the title is generated.??You can choose the elements to use for title, such as Test Name, Test Number, DataSet name, and more.??You can also limit the (number of characters) of the Title.??If the title appears in the wrong place in your graph, click on it with the mouse, hold and drag it to where you want it.
The ?Remove all Failing Records? checkbox in?RecordView?will quickly exclude all records with failing bin values.??All test values for all tests are excluded for these records.??The records will appear grayed out in?RecordView. The records are easily added back in by either unselecting the checkbox or by selectively including them using the table in?RecordView.
Changing device Ids is an important and common task in DataView.??Device Ids are used to identify records (device test records) through most analysis techniques.??Ensuring they?re correct is important for activities like Scatter Plots, Gage R&R, and correlation.??To modify them, use the button under Edit called ?Edit Device Parameters?.??Select the parameter to use for the new device ide and click OK.??Options such as Site number, X/Y coordinates, wafer number, test value, and more can be selected and used as the device Id.???You can also modify and edit the names manually using?RecordView.??Simply right-click on the Device Column and select ?Edit Device Ids? to manually edit, copy and paste new Ids for your device records.??The device column will turn yellow to indicate editing is enabled. Right-click and select ?Update Device Ids? when done.


RecordView?allows you to quickly select groups of parts several different ways.??To select parts by bin number, use the pane to the lower left labeled ?Find Records by Bin?.??Click on the bin of interest and all records from that bin will appear in the main Record Table.??Likewise, for viewing records by file use the ?Find Records by File? selection pane.??There are several other options for selecting groups of records found in?RecordView.
Use?RecordView?to select the bad test records and use the Exclude button to remove them.??Use the ?Find Records by File? selection pane to show all records in the file containing the records to be removed.
Lot Maps are custom graphs in DataView that show binning by Site.??Each row in a Lot Map corresponds to a single run of the test program and each column shows the binning value by site.??Lot Maps are useful for visualizing the efficiency of handlers and probers and for identifying problems with?loadboards?and test sockets.

The ‘Switch Views’ button at the top of most View pages allows you to quickly view the same test and settings on another page or View. ?For example, if you’re analyzing a particular test in HistoView and are interested in seeing the same test in TrendView, select the ‘Switch Views/Show Test in TrendView’ button and the same test and settings will be displayed on the TrendView page.
This functionality is also handy for creating Custom DataSets. ?You can zoom in on a section of a graph (mouse-click, drag-select), then click ‘Switch Views/Show Records in RecordView’. ?The records selected in the zoomed in graph will be displayed in RecordView, allowing you to create a Custom DataSet for just the zoomed in records.
The Slide Show button allows you to cycle through all the Report Items you?ve accumulated and see them, one after another.??Each item will be displayed in its corresponding View for an adjustable amount of time before cycling to the next item.??Control the speed, move forward/reverse/pause/restart at any time using the Slide Show menu.
