Correlation Analysis Techniques
Knowing a few basic correlation analysis techniques can be a big help in test engineering.? For example, when you create a new test program for a device it?s pretty common to have to correlate a few critical tests to application?s bench setup.? Or, you change the tester hardware when production ramps up (go multisite!) ? and correlate the new hardware to the old single site board.? You optimize the test program for throughput ? and correlate to the known stable results of the old, slow program.? You transfer your fab/test/assembly to a different manufacturer? and correlate to the old, known process. You get the idea.
Identifying correlation (or lack of) isn?t a simple, straight-forward process.? Generally, it takes a series of techniques, almost a hierarchy of methods to reduce the amount of overhead and focus in on what matters. And there might be loads of data, even thousands of tests, encoded in different formats that need to be processed and merged, each test requiring its own analysis and inspection. ?It can be little confusing and somewhat subjective at times.
For what it?s worth, here?s a very simple example using a project I worked on years ago.? It?s not meant to be a comprehensive guide on correlation, more of a demonstration of a few techniques I?ve found useful as a test engineer.? In following example, the goal is to check for correlation between the application team?s bench measurements and my ATE test results for three tests.
- I got the devices from the application team, 24 serialized devices along with an Excel spreadsheet containing the readings for three tests: Offset, Gain1, and Gain3. I took the devices and tested them on the ATE taking care to ensure the serial numbers in the ATE datalog matched the serial numbers of the devices.? Next, I took the bench Excel data, saved the file as comma separated (CSV), and opened this file along with the ATE datalog (STDF) using DataView.
- Next, I sorted through the tests and ranked them based on their likelihood of issue or miscorrelation. An easy first-filter technique is to look for shifts in the data.? I generated the following three tables in DataView: Cpk Values, Percent Limits (%Limits), and Percent Difference (% Diff).
Cpk Values, Sorted

% Limits:? (Baseline ? New)/(Ulimit ? Llimit) * 100, Sorted

% Difference:? (Baseline ? New)/Baseline * 100, Sorted

The first table has many of the common descriptive stats for the Bench and ATE data and I sorted them based on low-to-high Cpks.? For the second table, I used the Compare DataSets functionality in DataView to compare the means of the two datasets and express this as a percentage of the limits (% Limit).? This calculation is very similar to Cpk in that it is based directly on the limits. Cpk and % Limit are of limited use if the test limits are arbitrarily set, meaning they are not statistically set.? When I?m analyzing tests without decent limits or when the Cpk values are very high, I use % Difference (third table) as another data point.? I should mention all three techniques are somewhat trivial in this example because we?re dealing with 3 tests. This first-line analysis is more useful when dealing with hundreds or thousands of tests and can be helpful for sorting out worst-case, high-priority issues.
- Because I had serialized data from the bench and matching data from the tester, I was able to do a paired Student?s T-Test. The paired T-Test requires matching or paired data for both analysis sets.? It is important that the device ID?s match between the bench data and the ATE data ? you need to ensure the devices are paired! ?Using the Bench and ATE data sets, I did a Student?s T-Test for each of the three tests to compare the means.? My null hypothesis was that the means are the same and I used a 5% confidence interval.? Using DataView, I got the following table:

Not exactly what I thought it would be? the Gain 3 test has a P value of less than 5% (95% confidence interval) meaning I should reject my hypothesis (the means are probably not same).? The Offset and Gain tests however have P values above 5% so there?s hope for them.
- Again because of the paired nature of the data, I was able to do a linear regression test for each of the tests. The best-fit line equation allows me to quickly identify potential offset and negative correlation problems (negative slope).

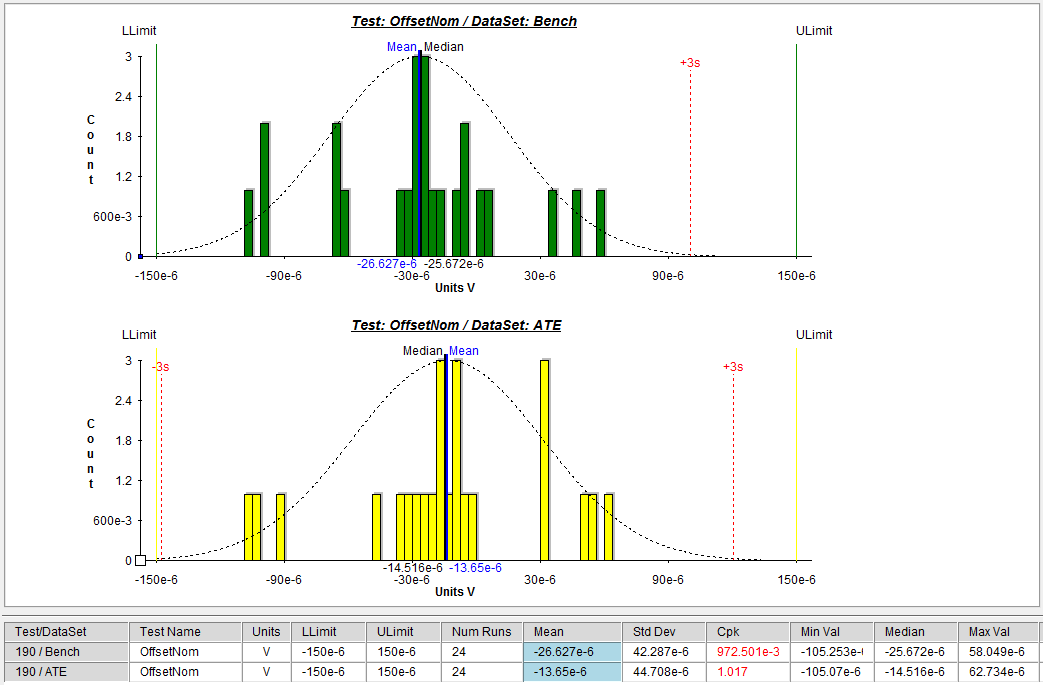
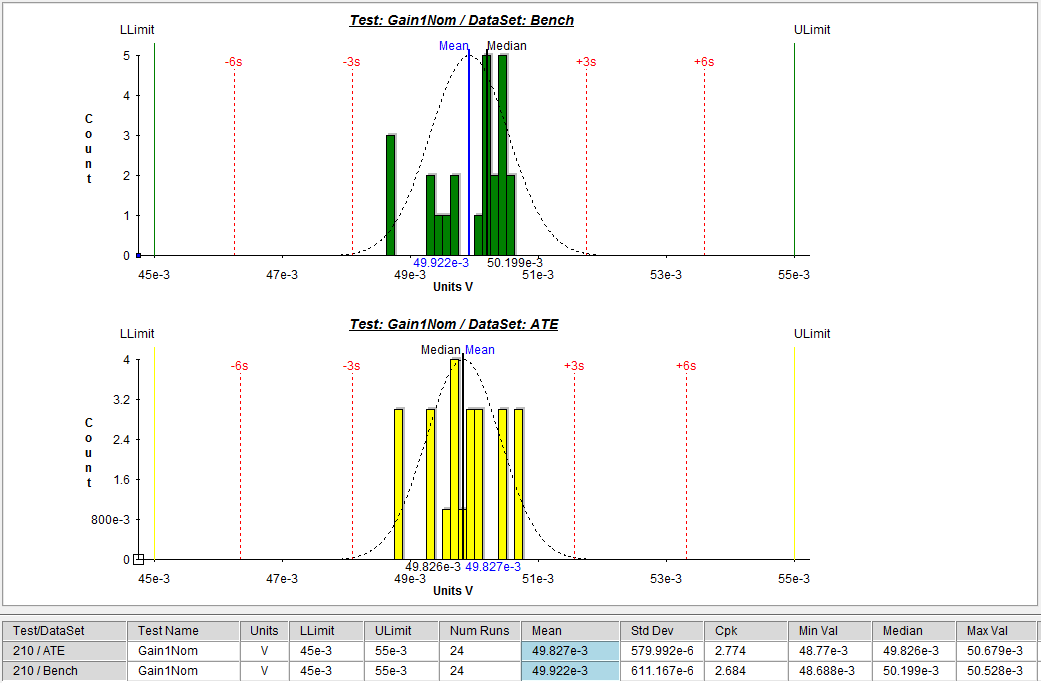
- I then plotted histograms for both the Bench and ATE data for each of the three tests (graphs below). The X scale is set to span between the lower limit and upper limit.? Notice the tight limits for the offset test ? a requirement driven by a datasheet specification.? We knew this test was going to be tough and you can see this with the spread of the histograms.? The two gain tests look ok though.
Offset Histogram
Gain 1 Histogram
Gain 3 Histogram

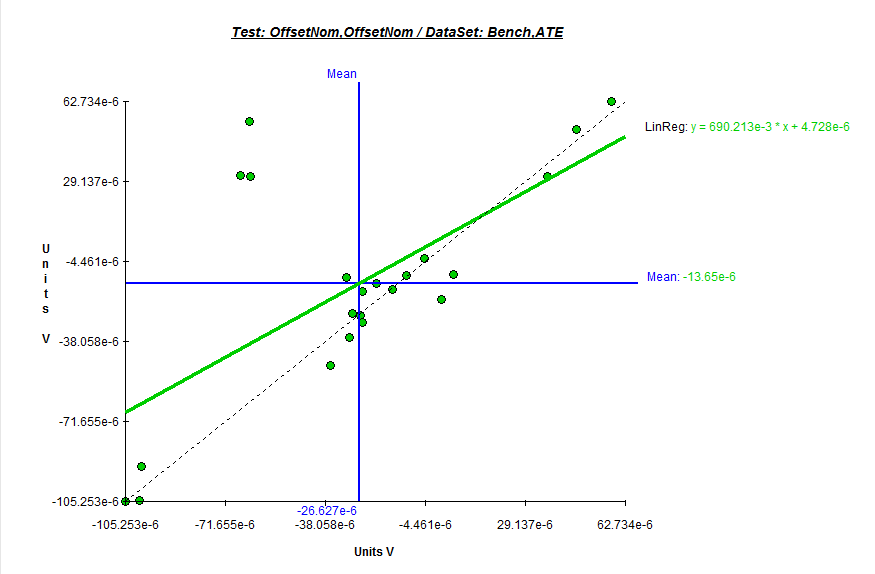
- With the serialized data I can do Scatter plots. I set the bench data as the independent variable (X axis) and the ATE data as the dependent variable (Y axis), I got the following scatter plots in DataView.? The dashed line represents a 100% correlation line.? Notice the Offset test isn?t too bad ? there are a few points that correlate well and the line has a positive slope.? There is an offset however of about 4.7uV.? The two gain tests show about 9mV and 12mv of offset and show a few of the devices might need to be verified again (notice the 3 devices top-left in Offset test and Gain3 tests).


And so, on? there are load of other techniques, parameters, and graphs that can be brought to bear. The previous sampling has been useful to me for paring down large sets of data and allowing me to do a more focused analysis or experimentation/debug on the tester with the high-priority issues.? As for the scenario presented above, I used the basic analysis to identify an offset problem with some of the active circuitry on our ATE loadboard.? I then went to the tester, did a few more experiments and determined I could correct the problem with calibration.
To learn more about this and other techniques for debugging your test program using data analysis, check out?the following white paper: ??Test Program Debug using Data Analysis?.